— Adobe Illustrator, Photoshop, PowerPoint/KeyNote
This project is a collection of infographics for use in presentations both internal and external to NASA. These informational slides were first used by J. Robinson during the 2021 NESFELS event (NASA Exploration Science Forum & European Lunar Symposium) on July 23rd (https://lunarscience.arc.nasa.gov/nesfels2021/program).
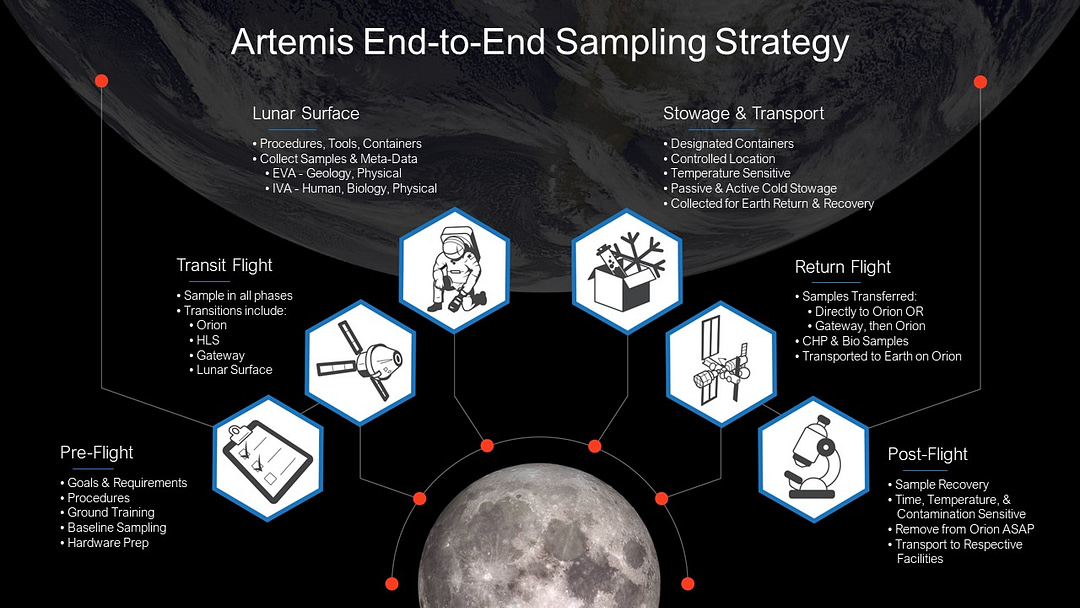
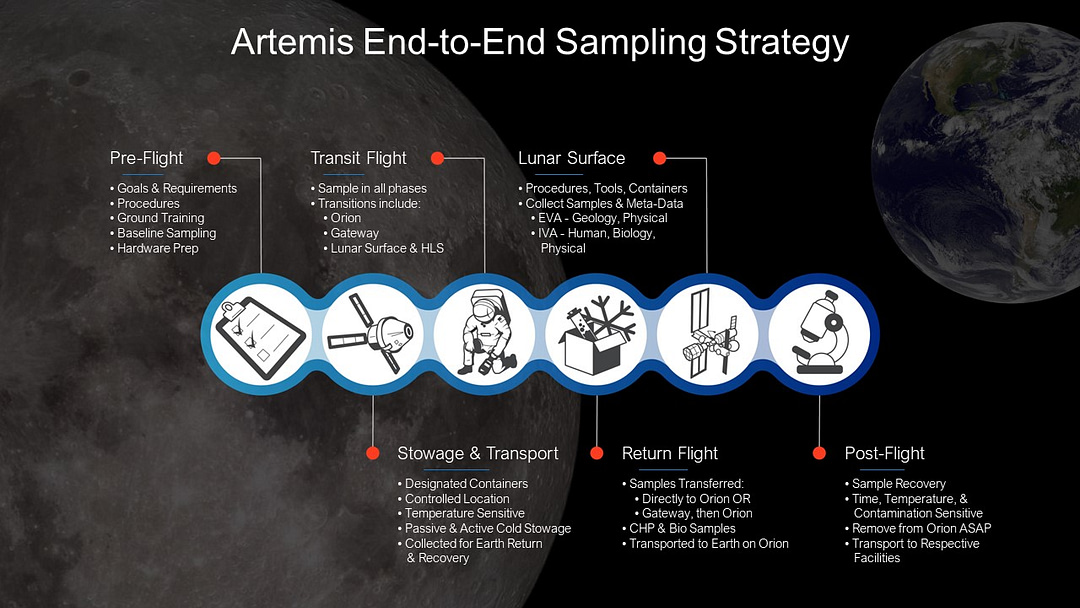
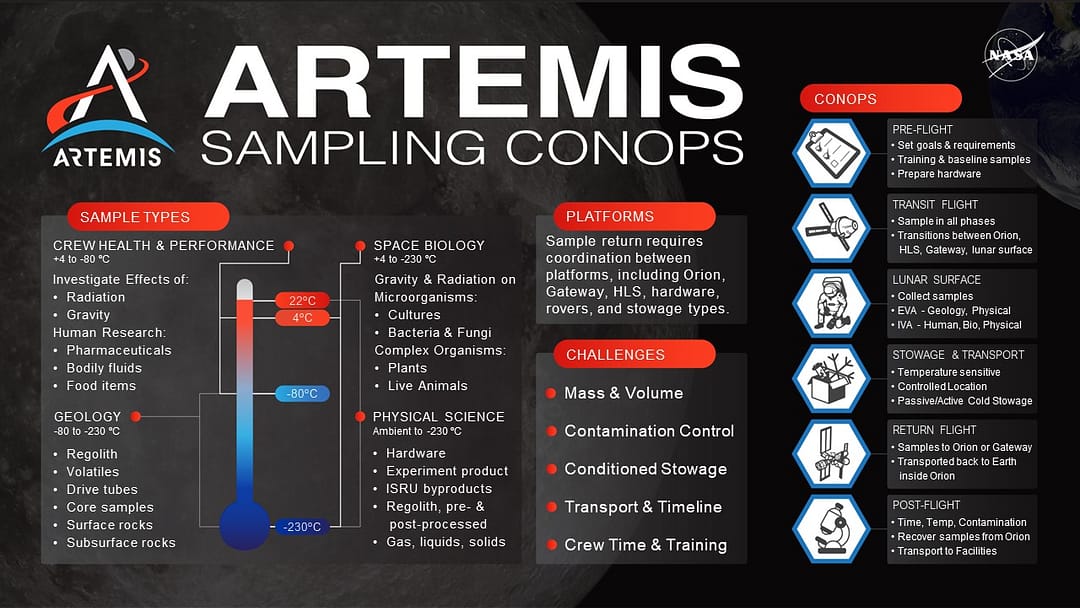
The main purpose is to explain the scientific process and considerations of collecting lunar samples, storing them, and returning them to Earth — as you can imagine, there is a lot of information to cram onto these slides!
PLEASE NOTE:
This project was created during an internship with NASA’s Artemis Communications Team. Some images may not be representative of the final release, which may have occurred after the end of the internship.
Many of the projects I completed with NASA have been or will be used for educational purposes, for stakeholder presentations, and for communication between different departments throughout the agency.
Specific details on the images below may change, particularly the temperature ranges.
Below are two versions of the same information.
The goal was to explore several different presentations for the details, then forward them to several teams. Most of the teams found that the curved version focused around the moon was easier to understand and helped to visually convey that all the details were happening around the Moon itself, with a start- and end-point back on Earth.
Enjoy!